| |
Sim pilots will usually know the corner velocity and the sustained turn velocity of their favorite fighter planes, but have only a rough idea of the flight envelope of their favorite mount. A tool that real fighter pilots use to analyze an aircraft's performance is the Energy-Maneuverability Diagram, or E-M chart.
This diagram shows a plane's turn and energy characteristics for a specific load and configuration, and is a very handy plot for predicting and comparing aircraft performance. It shows the relationship between an airplane's current speed, G-load, turn rate, and turn radius, which are all essential data for the turn fighter. But the chart also reveals the changes in the airplane's energy state due to this maneuvering. An understanding of these characteristics is the secret weapon of the energy fighter.
The E-M chart plots an aircraft's flat turn performance, according to its speed and lift load. The X-axis is the Indicated Air Speed in miles per hour (mph), and the lift is in units of G. The Turn Rate is read off the Y-axis in degrees per second, and the Turn Radius is in units of hundreds of feet. The light gray lines in the background show lines of constant G and radius, allowing quick estimation of a turn and energy state. The heavy, colored lines show the plane's performance envelope, as defined by its lift limit and physical G limit. Exceeding the edges of the envelope for long periods means the aircraft has spun out, or the pilot has blacked out.
For this short example, we take the data from the P-38L Lightning as modeled in a popular air combat simulator. The simulated aircraft is loaded with 25% fuel and 100% ammo. The heavy blue line shows the regular Lift Limit, or the lift available for turning. The peak of this line is the corner velocity at 270 mph and 6.67 G, with a resulting turn rate of 30 deg/sec.
The sustained turn using full military power is at the peak of the purple line marked Ps=0: 160 mph and 17 deg/sec. With WEP, the peak of the red line marked Ps=0 WEP is 170 mph and 18.5 deg/sec. The green line running parallel to the lift curve is the lift limit with combat flaps. For the same air speed, the flaps provide extra lift available for more turn rate. The corner velocity using this curve is at 240 mph and a remarkable 33.3 deg/sec.
The lines marked Ps (specific excess power) indicate the change in energy state, expressing it as a change in altitude in feet per second. The most significant of these curves is Ps=0 (and Ps=0 WEP), which shows the sustained turn performance possible at speeds and G-loads within the envelope. To maintain energy while turning at higher speeds, keep the G-load within this curve.
Click to continue
. . .
|
|
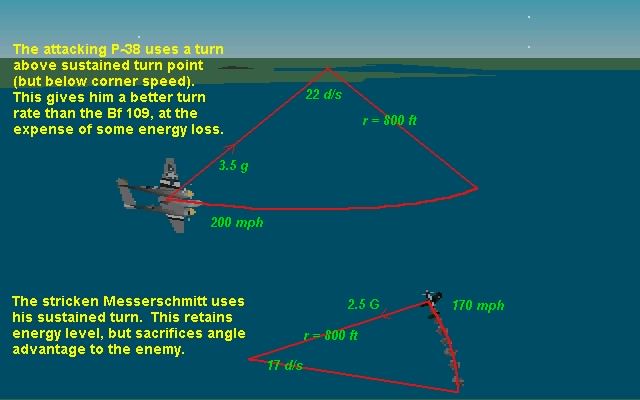
At points above the Ps=0 curve, turns cost energy. This energy loss is manifested by either a loss of airspeed or a drop in altitude. The curves marked Ps=-40 and Ps=-100 plot the relative loss incurred for high-G maneuvers. They show very clearly how an instantaneous turn at corner velocity cannot be sustained. However, it is possible to maintain the peak turn rate at Ps=-40, by taking a shallow dive to offset the energy loss. At 200 mph, a nose-down attitude of about 8 degrees is required, resulting in a descent of about 2400 feet per minute.
This chart also plots the Ps=0 curves for one and two notches of flaps. The thin, solid lines marked Flaps 1 and Flaps 2 use military power. The thin, broken line is Flaps 1 with WEP. Note that with Flaps 1 and WEP, the P-38 can sustain a 19 deg/sec turn at 150-160 mph. Why not fly with one notch of flaps all the time? The slope of the flaps curve is steeper, meaning quicker energy loss at higher speeds and G-loads.
The veteran sim pilot knows the performance characteristics of many planes from experience, but the pilot with less comprehensive knowledge can compare E-M charts of other planes to exploit the advantages of a better turn-to-energy ratio. In the next article we will do comparative analyses, and also see how an energy fighter can use this tool.
Reach Joseph at www.swlink.net/~jhong
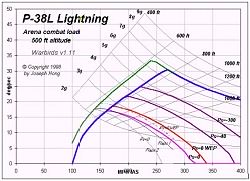
Figure 1: The E-M Chart shows how energy can be maintained in a flat turn.
|
|